• Skip to main content
  • Skip to after header navigation
  • Skip to site footer
Citizens' Climate Lobby UK

Citizens' Climate Lobby UK

Lobbying for a carbon fee and dividend

  • Home
  • The Problems
    • Climate Change Is Real
    • Climate Change Is Manmade
    • Climate Change Is Dangerous
    • Tragedy of the Commons
  • The Solutions
    • Carbon Pricing
    • Revenue Recycling
    • Border Adjustments
    • Climate Income
    • Citizens’ Role
  • Our Campaigns
    • Your Campaign, Your Way
    • Write to your MP
    • Set Up a Public Meeting
    • Run a Social Media Campaign
    • Influence Organizations
    • Campaign Request Form
  • Support Us
    • Join
    • Renew
    • Donate
  • About
    • Our Mission
    • Our Values
    • Our History
    • Our Structure
  • Contact
Image of a weather station

What Proportion of Weather Stations Show Warming?

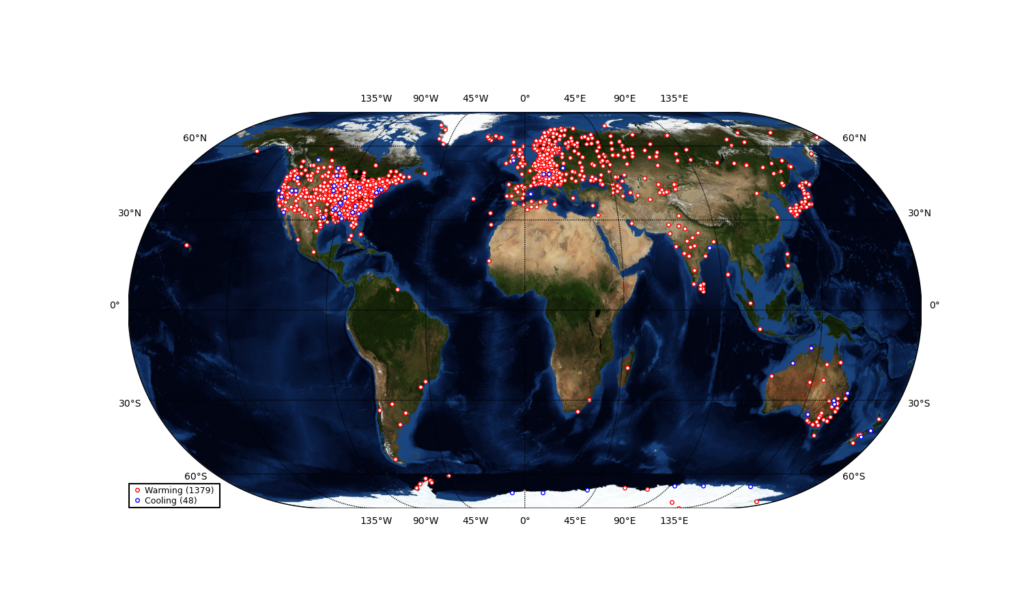
The HCLIM database contains the original meteorological records of thousands of weather stations based in 118 countries around the world with some of the records going back into the 19th century. This database had no records from Antarctica so we added in the data from Turner et al, 2019.

Of 1427 stations in this database that have reasonably complete data since 1970, 1379 of them show a warming trend and only 48 show cooling.

Imagine tossing a coin 1427 times and only getting 48 heads. You wouldn’t take seriously a claim the coin was fair, so you also shouldn’t take seriously any claim the world isn’t warming.

Global map showing locations of warming and cooling weather stations.
Return to Climate Change is Real
Citizens Climate Lobby UK

An informally constituted community group

Follow Us on Social Media

  • Facebook
  • YouTube
  • Instagram
  • LinkedIn

Copyright © 2026 · Citizens Climate Lobby UK · All Rights Reserved · Privacy Policy